Understanding Migration through Public Datasets
/
Written by Yashita Singh (CLAPs, IIHS)
Edited by Sofia Juliet Rajan (CLAPs, IIHS)
What do you understand by migration? Is it the movement of people? How do we quantify who is moving where, and why, across a large number of villages, towns and cities in India? Are there any systematic ways to measure and record the counts, reasons, destinations, and timing of movement to understand migration patterns? And why should citizens and governments care?
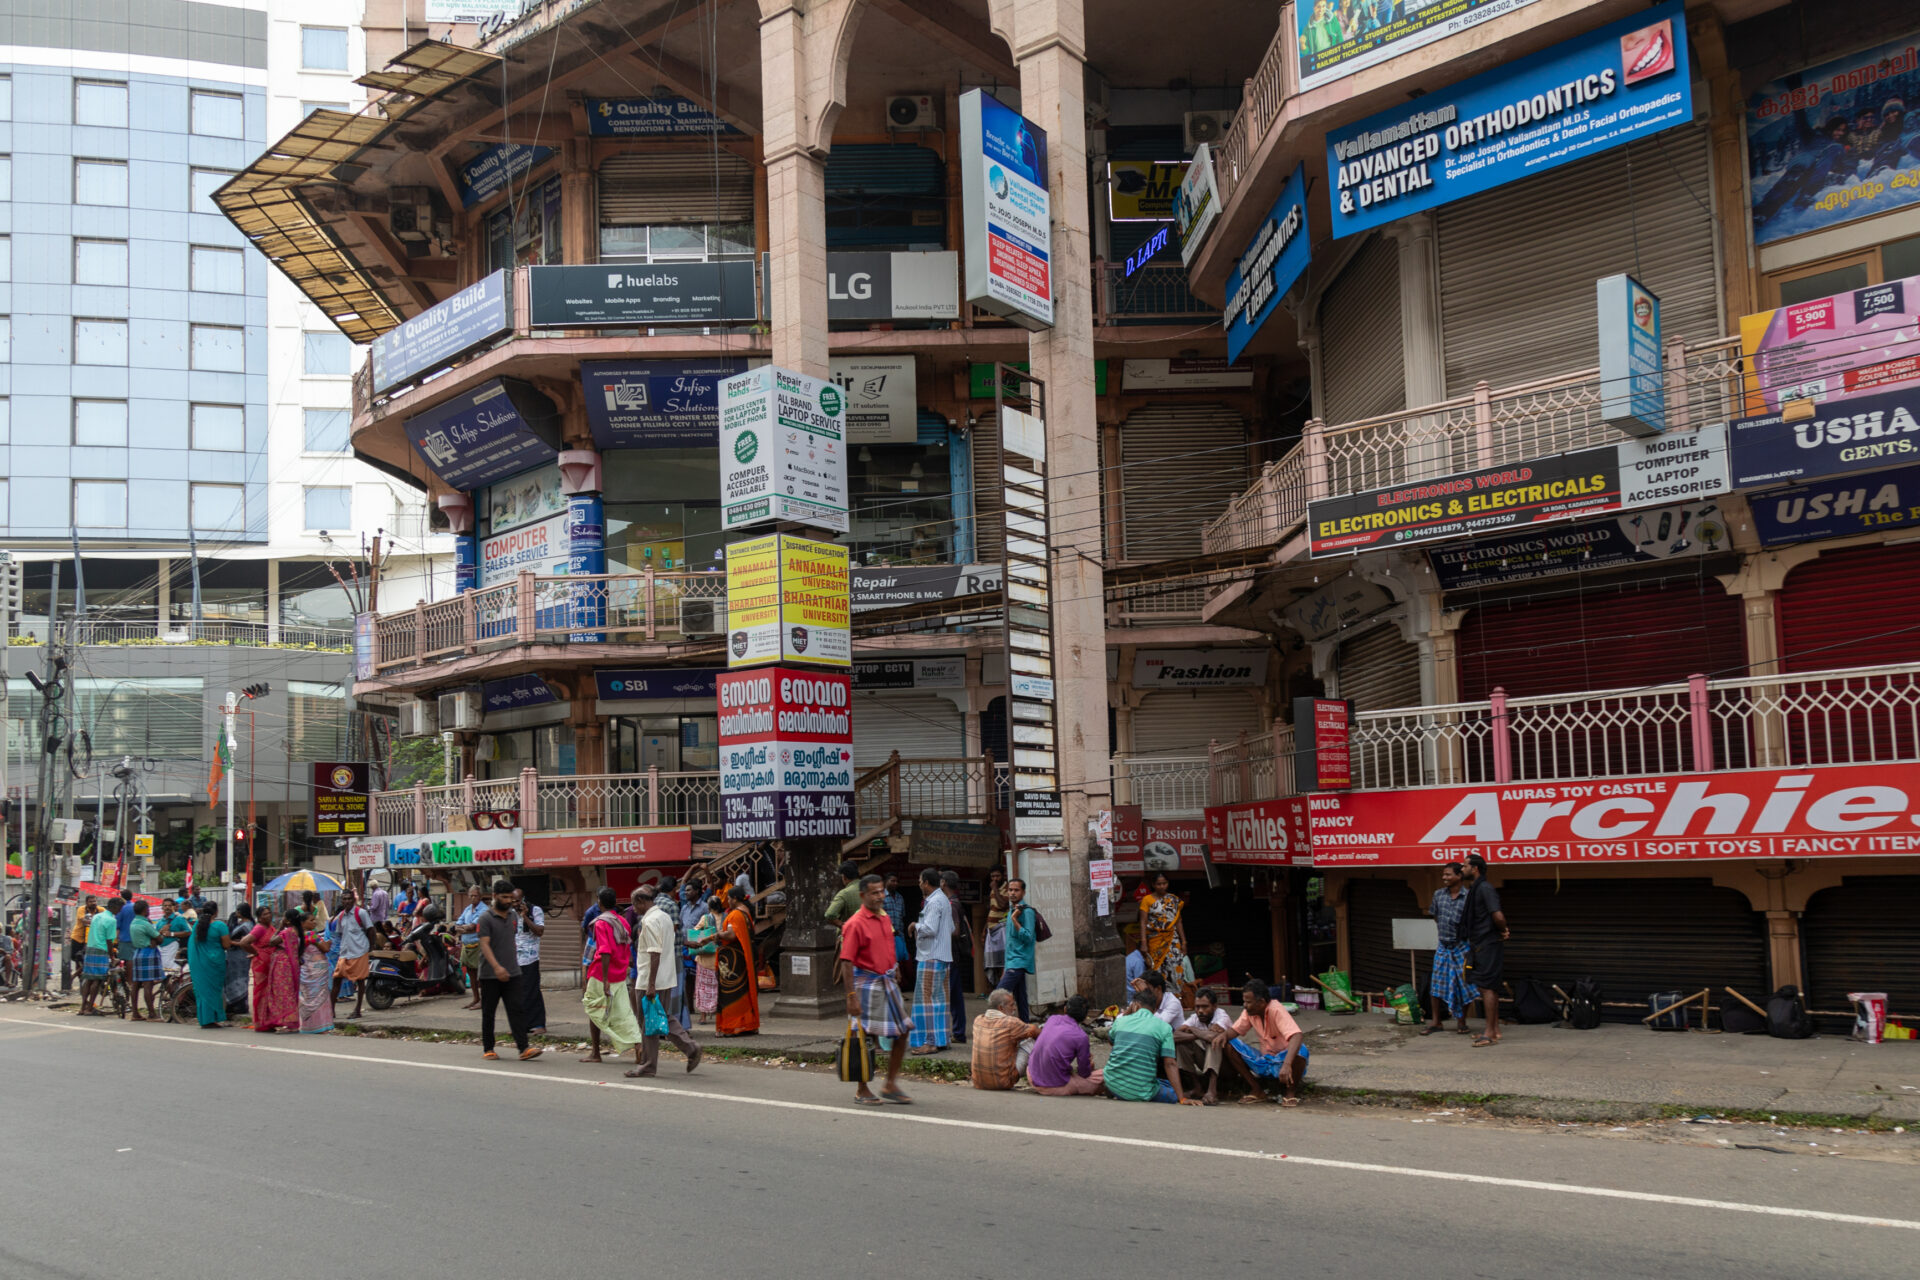
In India, migration is impossible to ignore and has been part of our culture. While the Census says most migration is due to marriage, it also moves in step with urbanisation. This migration is often driven by agricultural distress, shift in economic opportunities, and social change.
Our last Census was in 2011, which said that 45 crore people (35% of the total population) were migrants, based on change in place of residence, including all durations of migration. This includes 5 crore inter-state migrants. These numbers have increased since, but we can’t say that without solid evidence. The Economic Survey of 2017 estimated that ~1 crore (9 million) people moved annually, using railway passenger data of unreserved seats serving as a proxy for labour migration. We need these numbers to plan for better housing, design effective safety nets, and reduce inequality while improving well-being.
Why Measuring Migration is Complex
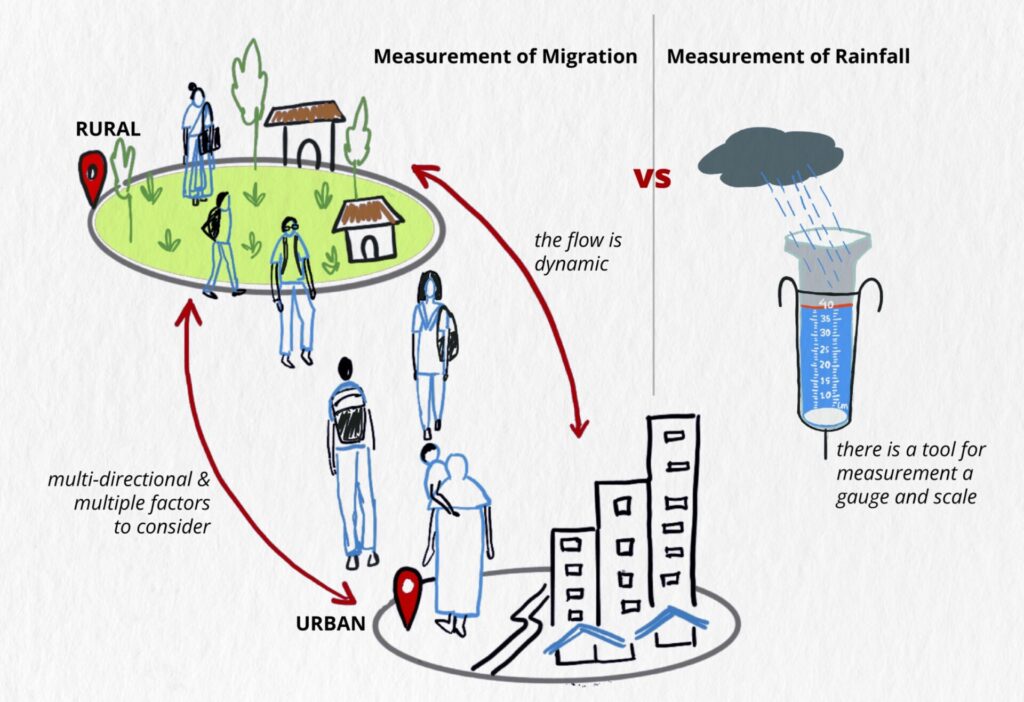
Migration is a dynamic phenomenon and challenging to capture in a single dataset, especially in a country as vast and diverse as India. I have realised that even a basic familiarity with public datasets is crucial, not just for analysis but also to improve how we collect and use migration data.
When I started working on secondary migration datasets in mid-2023, I found India’s conventional sources are the decadal Census and the National Sample Survey (NSS). While the census focuses on population attributes and the NSS survey on employment, both include some migration questions but are not designed solely to measure migration.
The Periodic Labour Force Survey (PLFS), launched in 2017, replaced the NSS Employment and Unemployment Survey of 2007-08, and is considered the richest public source of migration-related data. The 2020–21 PLFS round included migration details, partly shaped by the COVID-19 context, and added questions on “temporary visitors”. The data showed a shift in livelihood strategies, especially among casual wage workers who returned to rural areas pandemic disruptions. Many relied on Mahatma Gandhi National Rural Employment Guarantee Scheme (MGNREGS) as a safety net unavailable in urban areas, influencing mobility patterns and diminished willingness to migrate again.
However, I found the migration data in recent PLFS rounds less robust than in NSS 2007-08. PLFS remains labour-centric in design, and migration questions are not consistently included. The 2020-21 round was an exception. This inconsistency may stem from the need to keep labour statistics standardised and timely release of annual and quarterly estimates, as adding migration modules would require changes to sampling design and survey workload
Through this process, I realised that each dataset has distinct use cases, advantages and shortcomings depending on the purpose, context and scale of inquiry. For example, the Monthly Per Capita Expenditure (MPCE) data in NSS 2007-08 can be linked with migration to evaluate its economic aspects.
An insight from the Migration in India report (2007-08) highlights this link: “Migration rate was found to be lowest for bottom MPCE decile class in both rural and urban areas and there is an increasing trend in the rate of migration with the increase in the level of living, with the migration rate attaining peak in top decile class”.
Since the NSS is a sample survey, its findings apply only at the state or NSS region level. These regions combine multiple districts with similar characteristics. The Census, by contrast, covers the entire population and enables subnational level and more granular analysis at the state, district and urban agglomeration levels. However, even the Census does not provide directly accessible data on village-level migration patterns, leaving significant gaps in understanding rural mobility at the most local scale
Why Definitions Matter
How migration is defined and measured shapes how we calculate magnitudes, track population shifts and flows, and understand the reasons and factors driving migration.
It is fascinating how migration patterns vary so distinctly across socio-economic dimensions like gender, caste, access to environmental resources, and economic opportunities. These nuances make it vital to approach migration measurement with sensitivity and precision. When migration reality is translated into numbers, it tends to overlook these variations. Well-designed datasets should help decode these complexities, but definitions can just as easily reinforce or challenge certain narratives.
How Public Datasets Define Migration
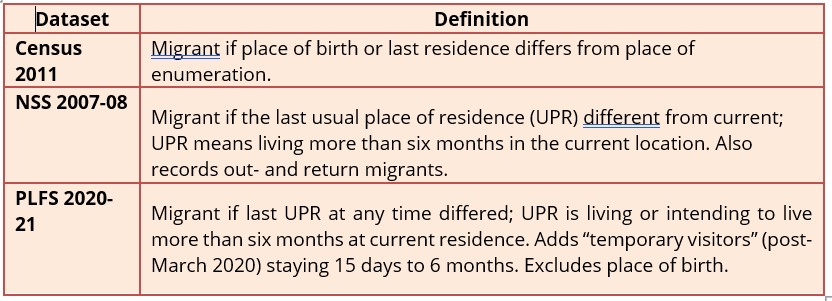
Source: Census of India, Ministry of Statistics and Programme Implementation
Choosing the Right Variable
It is useful to put some thought into deciding which variable to use while calculating migration. The Census uses place of birth and place of last residence, which produce different estimates.
The place of birth criterion can often be misleading. For instance, if families move after a child’s birth, the change may have nothing to do with work. Because the Census collects data at the place of enumeration (the destination), in-migration is calculated directly. Outmigration must be inferred from place of birth, or by counting in-migrants from other states. The Census publicly released district-to-district outmigration data in 2001, but not in 2011. This is essential for granular analysis.
The place of last residence is harder to capture, and requires a clear definition. PLFS uses a six-month threshold, but it may affect results.
Duration is also a key indicator to capture long-term, short-term or temporary migration in the Census. But the shortest category is “less than a year”, making it ineffective for capturing seasonal or temporary migration, a prominent phenomenon in India. Reducing this to six or three months, along with questions on intention to stay or return could improve seasonal migration estimates. The inclusion of Scheduled Caste (SC) and Scheduled Tribe (ST) tables is useful in showing how mobility patterns differ for marginalised groups.
Key Variables in Public Datasets
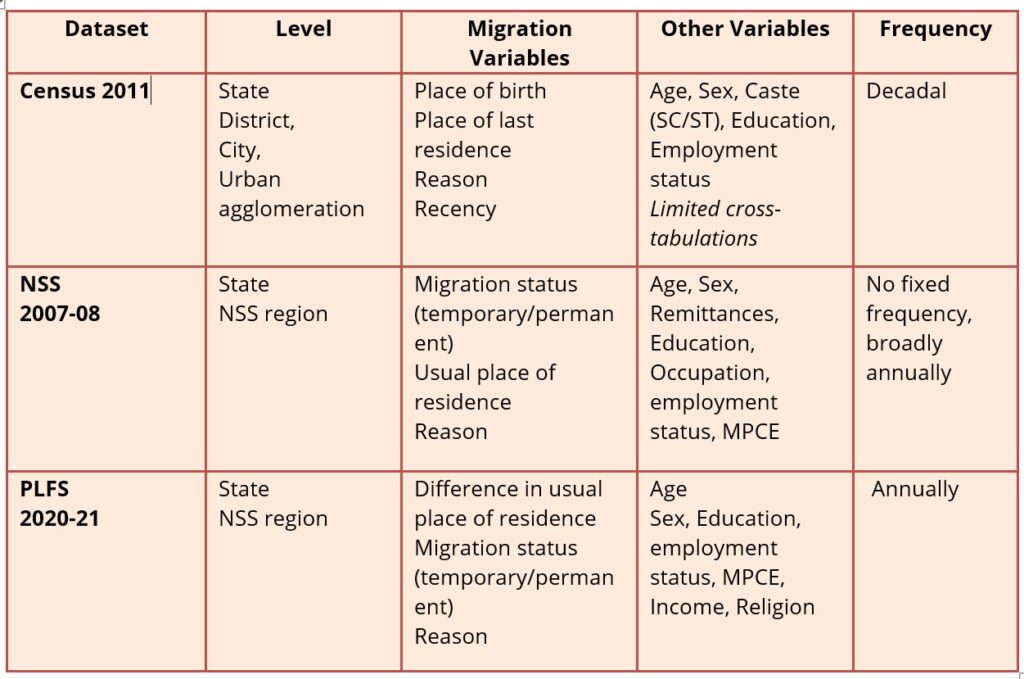
Source: Census of India, Ministry of Statistics and Programme Implementation
Cross-tabulations and Gaps
The Census data enables rich cross-tabulations, but key links are missing. For example, linking migration data with education and industrial sectors could help assess how migration affects livelihoods and quality of life. However, the Census’s industrial categories (based on NIC 2008) cannot be directly cross-tabulated with migration tables.
By contrast, PLFS 2020-21unit data allows direct comparison of migration and industry categories. Yet, the data suffers from limited spatial granularity, with estimates representative only at the NSS region level. Some useful indicators NSS 2007-08, such as remittances and the number of moves, are also absent in PLFS. Restoring them would strengthen policymaking for remittance-dependent regions and allow better differentiation between migration types. The “number of moves” indicator helps distinguish both the type and quality of migration, whether it is low-skilled, such as construction work taken up alongside agriculture in source regions, or high-skilled, such as white-collar migration. Another example is female migration, which Census data often records as marriage related. In reality, many women also work in their destination regions, but this labour remains largely invisible. Capturing only one move and reason may compromise information on important movements driven by childbirth, marriage or work.
Despite limitations, public datasets remain invaluable for understanding broad migration and serve as a foundation for primary surveys. Large-scale surveys like the census limit the level of nuance it can accommodate. But state surveys, such as the Kerala Migration Survey, provided key statistics on remittances and region-specific patterns like gulf migration decline.
Future public dataset releases could improve coverage by enabling better cross tabulations, publishing district-district outmigration flows and ensuring timely data. In cases where decadal datasets are delayed, interim state-level migration data would help track the mobility dynamics. Understanding the data collection process and limitations of public data is essential for designing safety nets like the public distribution system, employees’ provident fund, rental housing, healthcare and education. Primary survey findings can be cross-validated with public datasets, but without a robust public framework, validation and triangulation suffer.
I am still eagerly awaiting the next census, now expected in 2027, after 17 years.
Further Reading:
Tumbe, C. (2018). India moving: A history of migration. Penguin Random House India Private Limited.
Kundu, A. (2018). Mobility in India: Recent trends and issues concerning database. Social Change, 48(4), 634-644.
Srinivasan Ramani, Jasmin Nihalani. (2024, August). A snapshot of migration in India: Who moves, why and where—The Hindu.
S. Irudaya Rajan,Arif Nizam. (2025, August 21). India’s democracy is failing the migrant citizen—The Hindu.
Categories
Countries
CLARE Pillars
CLARE Themes
CLARE Topics
Published
CLARE Projects
CLARE Partners